Analyzing Data
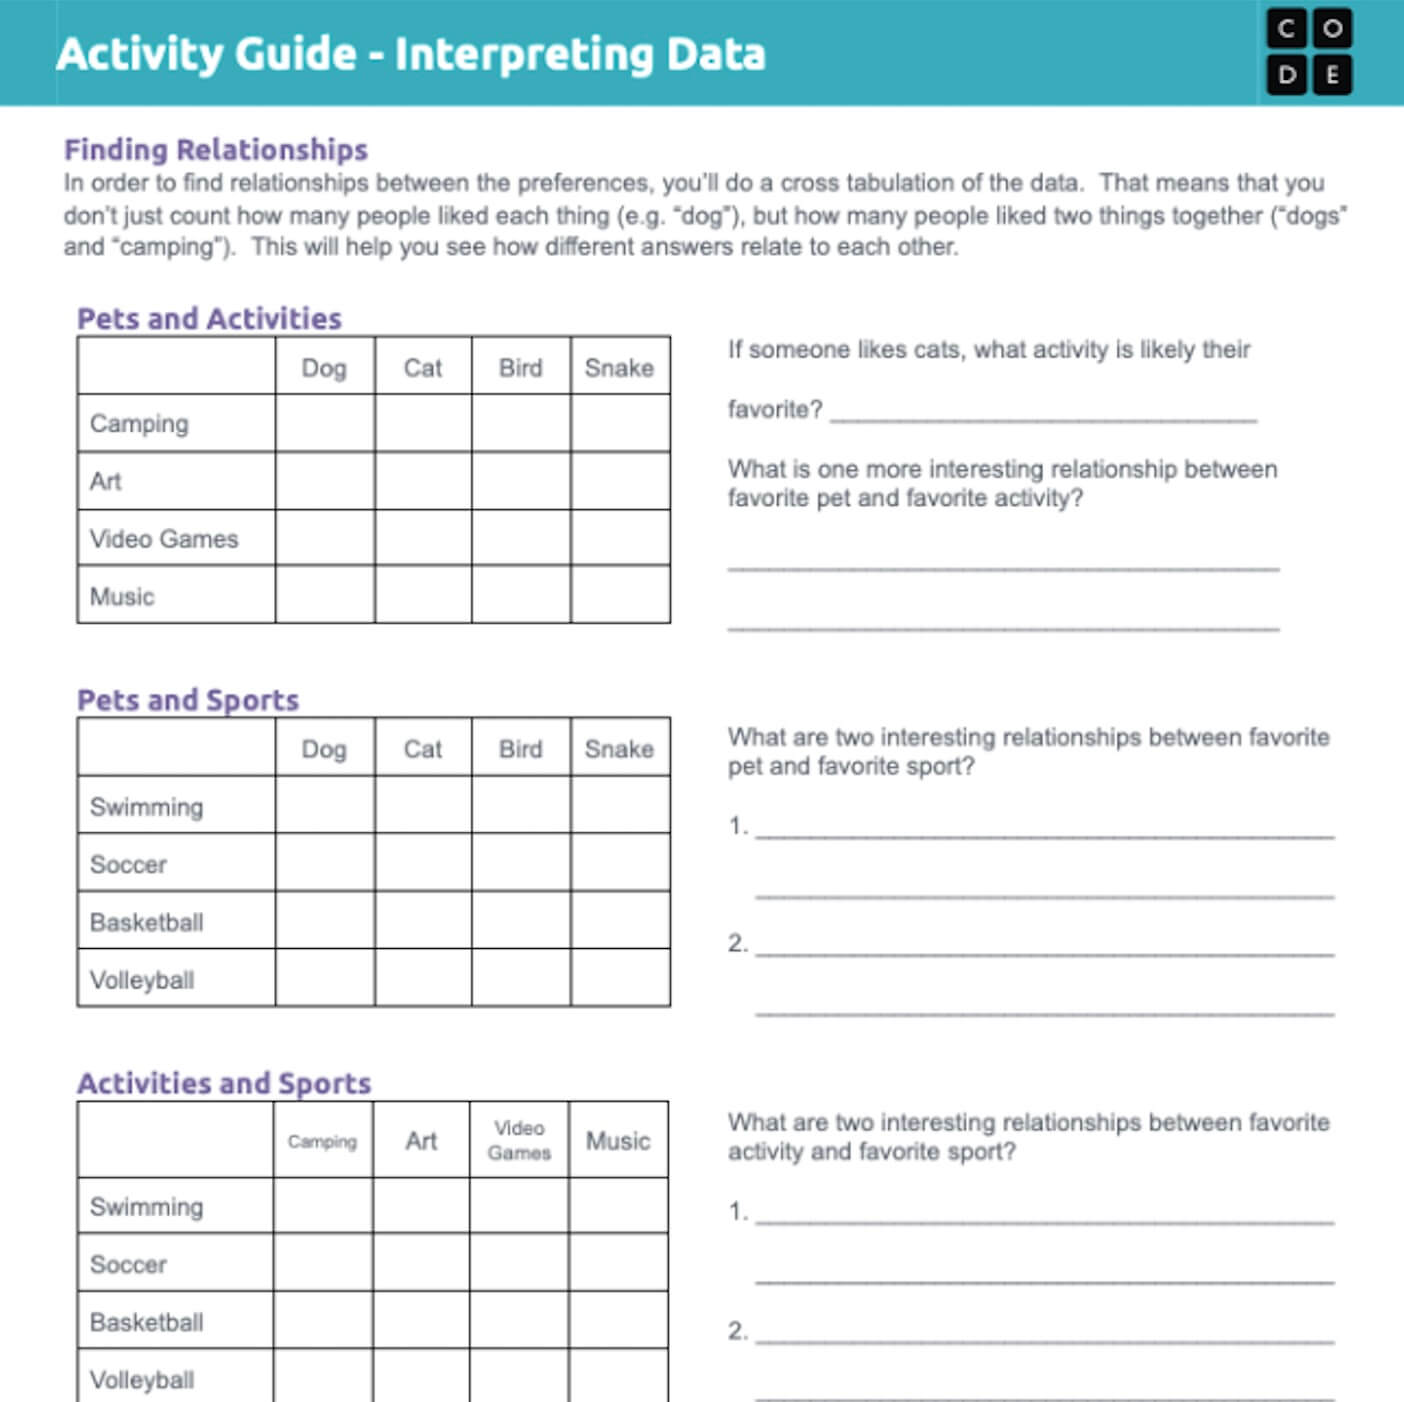
Students begin the lesson by looking at a cake preference survey that allows respondents to specify both a cake and an icing flavor. They discuss how knowing the relationship between cake and icing preference helps them better decide which combination to recommend. They are then introduced to cross-tabulation, which allows them to graph relationships to different preferences. They use this technique to find relationships in a preference survey, then brainstorm the different types of problems that this process could help solve.
Materials
-
Interpreting Data Lesson Plan - Code.org
https://studio.code.org/s/data-society-2024/lessons/11 -
Interpreting Data Activity Guide - Code.org
https://docs.google.com/document/d/1JZJ5-kZoHb6xI7B4Ua5EHwaS1UiLoeM8i6YUNAAbaEM/edit?tab=t.0 -
Interpreting Data Survey Results - Code.org
https://docs.google.com/document/d/1KC2wlSjvxZxZqZiezrtUZrPsGumkI70hkJDagR1gNDE/edit?tab=t.0
Tips for Running Lesson
- Even though each of these sheets is only one page, it’s best to print them separately, so that students can look at the survey results while they fill in the chart.
- Students may be tempted to think of reasons that different preferences are related. Remind them that there is nothing in the survey that helps them to understand why a relationship is true, only that the relationship exists.