Structuring Data
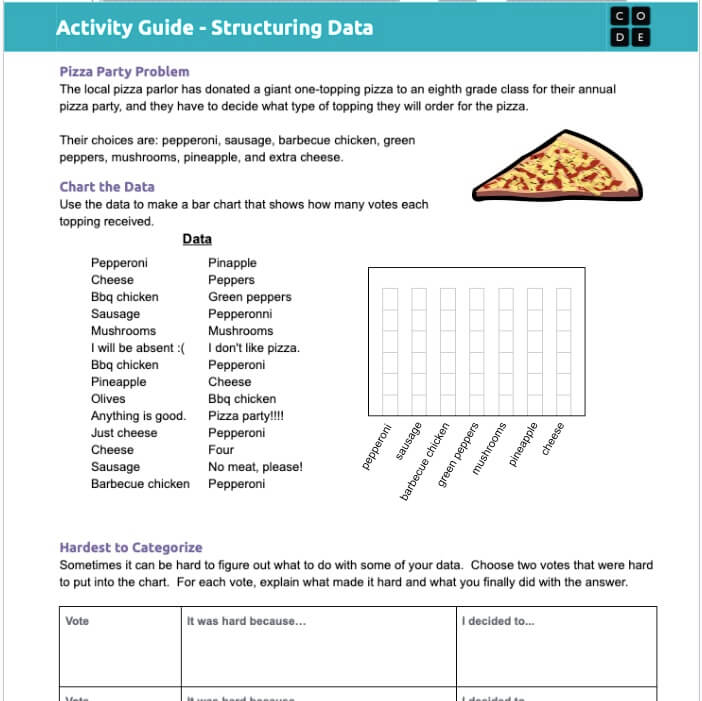
In this lesson, students go further into the collection and interpretation of data, including cleaning and visualizing data. Students first look at how presenting data in different ways can help people to understand it better, and they then create visualizations of their own data. Using the results of a preferred pizza topping survey, students must decide what to do with data that does not easily fit. Finally, students discuss which parts of this process can be automated by a computer and which need a human to make decisions.
This is a great primer lesson to help students understand that the better your collection of data, the easier it is to analyze it. This lesson should be taught prior to having students collect data for other data science lessons or for any other project they are collecting data for.
Materials
-
Structuring Data Lesson Plan - Code.org
https://studio.code.org/s/csd5-2024/lessons/10 -
Activity Guide - Code.org
https://docs.google.com/document/d/1edTTFHTHp4uxIi1CrHvvfEfFCZacCB5BXNfL1uaBf-E/view?tab=t.0
Tips for Running Activity
- In data science, to most effectively analyze the data collected, we need to make sure that we clean the data and standardize it as much as possible. This activity helps demonstrate that in an easily accessible way for students.
- Students should see that there are several ways that answers might be difficult to categorize, whether they are completely irrelevant, not specific enough, or not a given choice.
- Students should notice that some data, such as minor misspellings, could be easily “cleaned” into an appropriate category, but that other data, such as “I will be absent”, needed to be removed from the set entirely.
Assessment Opportunities
- Have students share other potentially better ways that the class could have collected data to make it “cleaner” when analyzing it later.
- Brainstorm other items that students can collect data on from the class. Depending on the level and ability of the students, have them
- Have students share other potentially better ways that the class could have collected data to make it “cleaner” when analyzing it later.
- Brainstorm other items that students can collect data on from the class. Depending on the level and ability of the students, have them
- Have students share other potentially better ways that the class could have collected data to make it “cleaner” when analyzing it later.
- Brainstorm other items that students can collect data on from the class. Depending on the level and ability of the students, have them
Extension Opportunities
- Have students develop and create their own class survey to collect information on something (this could be “What is your favorite animal?” or something specific to the topic you are learning about in class “What is your favorite decade in US history?”)
- As they develop their survey, have them consider what will get them the cleanest data for them to work with and ensure their survey is setting themselves up for success.
- Students can rotate through and every student can fill out each of their classmates’ surveys so that the surveys each have as many survey results as there are students in the class.
- For students that want to take their survey skills to the next level, consider having them create a Google form for their classmates to fill out.