micro:bit Traffic Survey Data Logger
In this activity, students use the BBC micro:bit as a data logger to collect real-world observational data—most commonly by recording types of traffic such as cars, buses, and trucks. With a simple program, students press different inputs (buttons or touch sensor) to log each observation, which is automatically stored in a structured data table on the device.
Materials
-
micro:bit Traffic survey data logger Instructions
https://microbit.org/projects/make-it-code-it/traffic-survey-data-logger/ -
Data Logging Guide
https://microbit.org/get-started/user-guide/data-logging/ -
What is data logging?
https://youtu.be/JdQy0Lg7jwA?si=TtUIH1Ms9jenSNZN -
Example MakeCode Code
https://makecode.microbit.org/#pub:_1EAcowV1Tc4e
Activity Instructions
- Introduce the Activity
- Discuss:
- How do cities know how many cars drive on a road each day?
- Who collects that data?
- How could we collect it ourselves?
- Today, we are going to become data scientists and collect real-world data using the BBC micro:bit.
- Introduce Data Logging
- Data logging means collecting and storing data over time using a device. Instead of writing things down, your micro:bit will record and store the data for you.
- Optional: Watch what is data logging BBC video
- Code & Load the Program
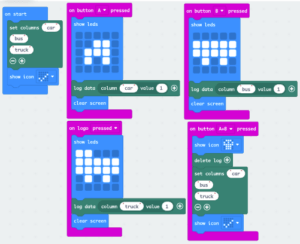
- The program below uses three vehicle categories: car, bus, truck. If you would like to change those categories make sure to change it throughout the entire program.
- Walk students through creating the following code or use the provided link to share the completed code with students.
- Collect Data
- Now it’s time to gather real data. Data can be collected anywhere using battery power, spread out to all can observe the area.
- Instruct Students to:
- Move to observation location
- Watch traffic (or another category if remixed)
- Press buttons/logo to log observations
- Tips:
- Be consistent
- Record accurately
- Avoid accidental presses
- Retrieve & View Data
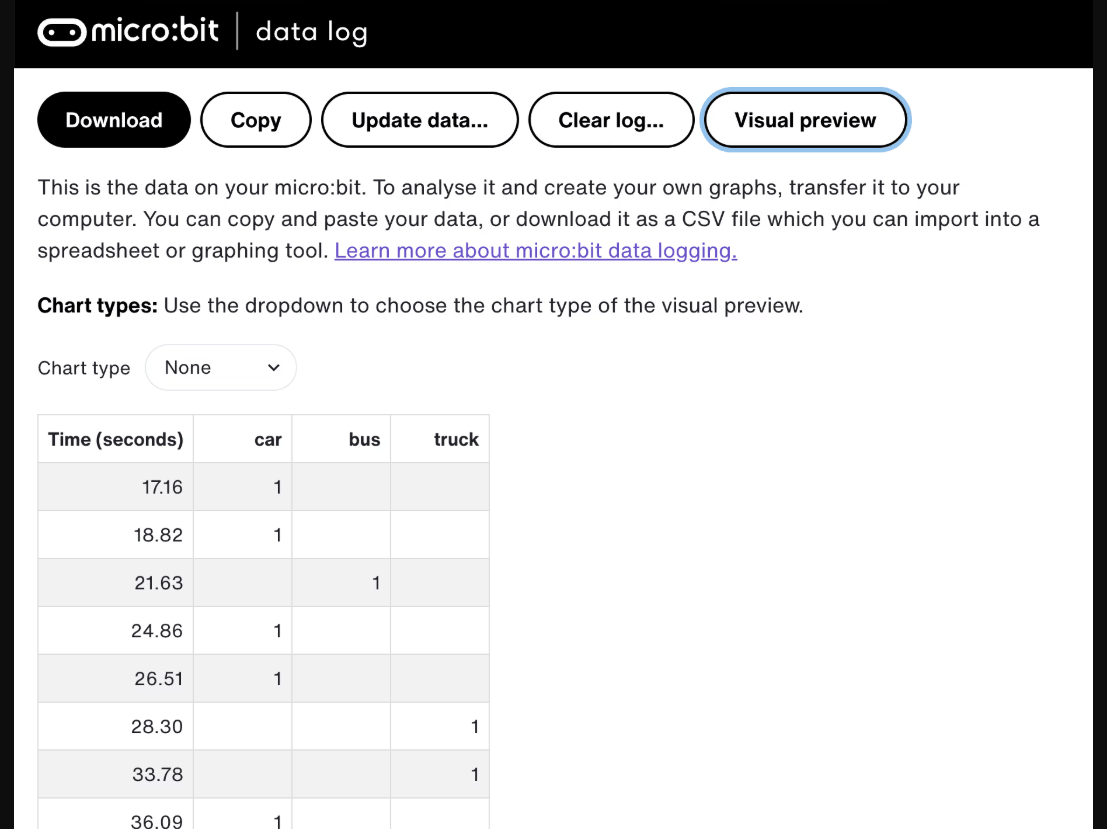
- Let’s see what your micro:bit recorded.
- Instruct students to:
- Plug micro:bit into computer
- Open the MY_DATA file
- View table of results
- Analyze & Visualize Data
- Now we clean, transform, and analyze your data.
- Discuss:
- What graph would make the best graph for this data?
- Which type of vehicle was most common?
- When did most traffic occur?
- What trends do you notice?
- Identify areas of data to be cleaned:
- Avoid accidental presses, etc.
- Identify patterns
- Discuss & Interpret
- What did your data show?
- Were you surprised by the results?
- How reliable is your data?
- Introduce the Activity
- Discuss:
- How do cities know how many cars drive on a road each day?
- Who collects that data?
- How could we collect it ourselves?
- Today, we are going to become data scientists and collect real-world data using the BBC micro:bit.
- Discuss:
- Introduce Data Logging
- Data logging means collecting and storing data over time using a device. Instead of writing things down, your micro:bit will record and store the data for you.
- Optional: Watch what is data logging BBC video
- Code & Load the Program
- The program below uses three vehicle categories: car, bus, truck. If you would like to change those categories make sure to change it throughout the entire program.
- Walk students through creating the following code or use the provided link to share the completed code with students.
- Collect Data
- Now it’s time to gather real data. Data can be collected anywhere using battery power, spread out to all can observe the area.
- Instruct Students to:
- Move to observation location
- Watch traffic (or another category if remixed)
- Press buttons/logo to log observations
- Tips:
- Be consistent
- Record accurately
- Avoid accidental presses
- Retrieve & View Data
- Let’s see what your micro:bit recorded.
- Instruct students to:
- Plug micro:bit into computer
- Open the MY_DATA file
- View table of results
- Analyze & Visualize Data
- Now we clean, transform, and analyze your data.
- Discuss:
- What graph would make the best graph for this data?
- Which type of vehicle was most common?
- When did most traffic occur?
- What trends do you notice?
- Identify areas of data to be cleaned:
- Avoid accidental presses, etc.
- Identify patterns
- Discuss & Interpret
- What did your data show?
- Were you surprised by the results?
- How reliable is your data?
- Introduce the Activity
- Discuss:
- How do cities know how many cars drive on a road each day?
- Who collects that data?
- How could we collect it ourselves?
- Today, we are going to become data scientists and collect real-world data using the BBC micro:bit.
- Discuss:
- Introduce Data Logging
- Data logging means collecting and storing data over time using a device. Instead of writing things down, your micro:bit will record and store the data for you.
- Optional: Watch what is data logging BBC video
- Code & Load the Program
- The program below uses three vehicle categories: car, bus, truck. If you would like to change those categories make sure to change it throughout the entire program.
- Walk students through creating the following code or use the provided link to share the completed code with students.
- Collect Data
- Now it’s time to gather real data. Data can be collected anywhere using battery power, spread out to all can observe the area.
- Instruct Students to:
- Move to observation location
- Watch traffic (or another category if remixed)
- Press buttons/logo to log observations
- Tips:
- Be consistent
- Record accurately
- Avoid accidental presses
- Retrieve & View Data
- Let’s see what your micro:bit recorded.
- Instruct students to:
- Plug micro:bit into computer
- Open the MY_DATA file
- View table of results
- Analyze & Visualize Data
- Now we clean, transform, and analyze your data.
- Discuss:
- What graph would make the best graph for this data?
- Which type of vehicle was most common?
- When did most traffic occur?
- What trends do you notice?
- Identify areas of data to be cleaned:
- Avoid accidental presses, etc.
- Identify patterns
- Discuss & Interpret
- What did your data show?
- Were you surprised by the results?
- How reliable is your data?
Assessment Opportunities
Reflection
- How did the micro:bit help you collect data?
- Why is digital data collection useful?
- What would you investigate next?
Reflection
- How did the micro:bit help you collect data?
- Why is digital data collection useful?
- What would you investigate next?
Reflection
- How did the micro:bit help you collect data?
- Why is digital data collection useful?
- What would you investigate next?
Extension Opportunities
- The project can be adapted to many different types of surveys. Students can:
- Survey different data:
- Wildlife
- School transportation methods
- Recycling types
- Export data to spreadsheets
- Create more advanced graphs
- Compare results across groups
- Present findings to an audience
- The project can be adapted to many different types of surveys. Students can:
- Survey different data:
- Wildlife
- School transportation methods
- Recycling types
- Export data to spreadsheets
- Create more advanced graphs
- Compare results across groups
- Present findings to an audience
- Survey different data:
- The project can be adapted to many different types of surveys. Students can:
- Survey different data:
- Wildlife
- School transportation methods
- Recycling types
- Export data to spreadsheets
- Create more advanced graphs
- Compare results across groups
- Present findings to an audience
- Survey different data: