micro:bit Environment Exploration
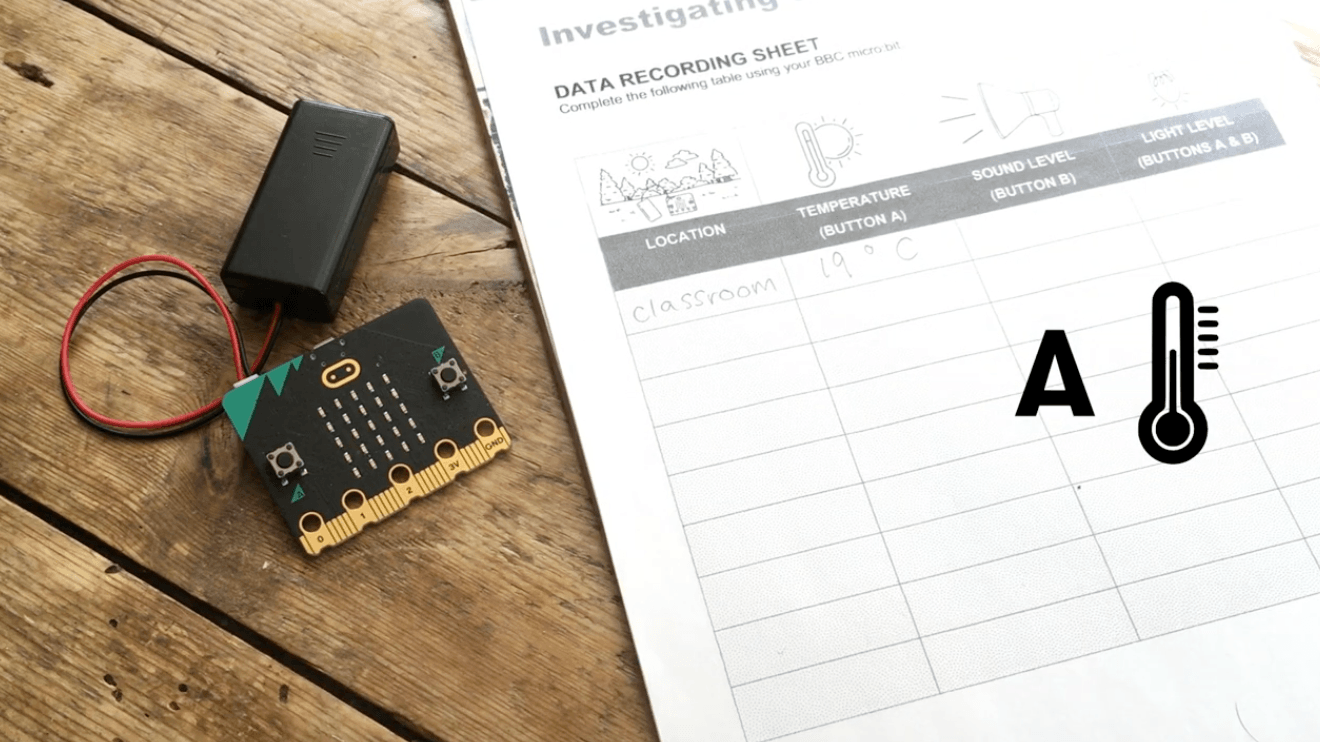
In this activity, students use the micro:bit as a multi-sensor scientific tool to investigate their surrounding environment. Students will program the device to measure temperature, light levels, and sound levels using built-in sensors, transforming the micro:bit into a thermometer, light meter, and sound meter.
Materials
-
BBC micro:bit Environment exploration Project link
https://microbit.org/projects/make-it-code-it/environment-exploration/ -
Environmental data recording sheet
https://docs.google.com/document/d/1flwFVailkX3i3D4K2psRZ1Wyy7aBIPis/edit -
Environment exploration introduction
https://youtu.be/M-3NQLbjuWQ?si=RwyreILvE6gtExQa -
Environment exploration coding
https://youtu.be/Z8RDOhLZOLQ?si=UucAQtZAUCRuMLuC -
Example MakeCode
https://makecode.microbit.org/#pub:_df3AkdckW3iP
Activity Instructions
- Introduce the activity
- Brainstorm the following questions related to the micro:bit:
- What if we could turn a micro:bit into a science tool?
- How could we measure things like sound, light, or temperature around us? (without a micro:bit and with a micro:bit)
- Introduce micro:bit as a scientific tool
- The micro:bit has built-in sensors that can measure the world around it.
- Explain:
- Temperature sensor → measures heat
- Light sensor → measures brightness
- Microphone → measures sound levels
- Optional: watch the BBC provided sensor videos
- Tell students – They’ll program the micro:bit using code to decide what data to collect and when.
- Program the micro:bit
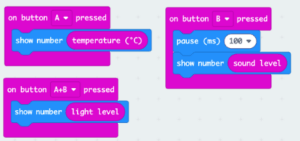
- Create code to using a button to trigger a different sensor reading
- Model in MakeCode:
- Button A → show temperature
- Button B → show sound level
- Buttons A+B → show light level
- Collect Data
- Pass out the data recording sheet
- Students can use the BBC data recording sheet for recording your measurements or you can create your own
- Top tip: gathering as much data as you can is good scientific practice, so you might want to take several readings in each location and calculate an average.
- Temperature
- Use the micro:bit as a thermometer to measure differences in temperature in different places. Press button A to show the temperature in degrees Celsius on the display. It’s a good idea to leave the micro:bit in a new location for a couple of minutes to ensure you get an accurate reading.
- Sound
- To use the micro:bit as sound level meter, press button B to show the sound level on a scale from 0 (quietest) to 255 (loudest).
- There’s a short delay before it takes the sound reading to make sure the sound of pressing the button isn’t recorded.
- Light
- To use the micro:bit as a light meter, press buttons A and B together. It shows light level readings, on a scale from 0 (darkest) to 255 (lightest).
- Analyze Data
- Let’s look for patterns in your data.
- Ask:
- Where was the warmest? Coolest?
- Where was the loudest? Quietest?
- Where was the brightest? Darkest?
- Discuss Findings
- What surprised you?
- What patterns did you notice?
- What factors might affect your data?
- Debug & Improve -If your readings seemed off, consider:
- Did you wait for accurate readings?
- Did background noise affect results?
- Did location matter?
- Introduce the activity
- Brainstorm the following questions related to the micro:bit:
- What if we could turn a micro:bit into a science tool?
- How could we measure things like sound, light, or temperature around us? (without a micro:bit and with a micro:bit)
- Brainstorm the following questions related to the micro:bit:
- Introduce micro:bit as a scientific tool
- The micro:bit has built-in sensors that can measure the world around it.
- Explain:
- Temperature sensor → measures heat
- Light sensor → measures brightness
- Microphone → measures sound levels
- Optional: watch the BBC provided sensor videos
- Tell students – They’ll program the micro:bit using code to decide what data to collect and when.
- Program the micro:bit
- Create code to using a button to trigger a different sensor reading
- Model in MakeCode:
- Button A → show temperature
- Button B → show sound level
- Buttons A+B → show light level
- Collect Data
- Pass out the data recording sheet
- Students can use the BBC data recording sheet for recording your measurements or you can create your own
- Top tip: gathering as much data as you can is good scientific practice, so you might want to take several readings in each location and calculate an average.
- Temperature
- Use the micro:bit as a thermometer to measure differences in temperature in different places. Press button A to show the temperature in degrees Celsius on the display. It’s a good idea to leave the micro:bit in a new location for a couple of minutes to ensure you get an accurate reading.
- Sound
- To use the micro:bit as sound level meter, press button B to show the sound level on a scale from 0 (quietest) to 255 (loudest).
- There’s a short delay before it takes the sound reading to make sure the sound of pressing the button isn’t recorded.
- Light
- To use the micro:bit as a light meter, press buttons A and B together. It shows light level readings, on a scale from 0 (darkest) to 255 (lightest).
- Analyze Data
- Let’s look for patterns in your data.
- Ask:
- Where was the warmest? Coolest?
- Where was the loudest? Quietest?
- Where was the brightest? Darkest?
- Discuss Findings
- What surprised you?
- What patterns did you notice?
- What factors might affect your data?
- Debug & Improve -If your readings seemed off, consider:
- Did you wait for accurate readings?
- Did background noise affect results?
- Did location matter?
- Introduce the activity
- Brainstorm the following questions related to the micro:bit:
- What if we could turn a micro:bit into a science tool?
- How could we measure things like sound, light, or temperature around us? (without a micro:bit and with a micro:bit)
- Brainstorm the following questions related to the micro:bit:
- Introduce micro:bit as a scientific tool
- The micro:bit has built-in sensors that can measure the world around it.
- Explain:
- Temperature sensor → measures heat
- Light sensor → measures brightness
- Microphone → measures sound levels
- Optional: watch the BBC provided sensor videos
- Tell students – They’ll program the micro:bit using code to decide what data to collect and when.
- Program the micro:bit
- Create code to using a button to trigger a different sensor reading
- Model in MakeCode:
- Button A → show temperature
- Button B → show sound level
- Buttons A+B → show light level
- Collect Data
- Pass out the data recording sheet
- Students can use the BBC data recording sheet for recording your measurements or you can create your own
- Top tip: gathering as much data as you can is good scientific practice, so you might want to take several readings in each location and calculate an average.
- Temperature
- Use the micro:bit as a thermometer to measure differences in temperature in different places. Press button A to show the temperature in degrees Celsius on the display. It’s a good idea to leave the micro:bit in a new location for a couple of minutes to ensure you get an accurate reading.
- Sound
- To use the micro:bit as sound level meter, press button B to show the sound level on a scale from 0 (quietest) to 255 (loudest).
- There’s a short delay before it takes the sound reading to make sure the sound of pressing the button isn’t recorded.
- Light
- To use the micro:bit as a light meter, press buttons A and B together. It shows light level readings, on a scale from 0 (darkest) to 255 (lightest).
- Analyze Data
- Let’s look for patterns in your data.
- Ask:
- Where was the warmest? Coolest?
- Where was the loudest? Quietest?
- Where was the brightest? Darkest?
- Discuss Findings
- What surprised you?
- What patterns did you notice?
- What factors might affect your data?
- Debug & Improve -If your readings seemed off, consider:
- Did you wait for accurate readings?
- Did background noise affect results?
- Did location matter?
Tips for Running Activity
- Add ‘show string’ blocks to make it clearer when temperature, sound and light readings are being displayed.
- You can modify the code to show temperature readings in Fahrenheit – see the BBC Fahrenheit thermometer project for tips on how to do this (https://microbit.org/projects/make-it-code-it/fahrenheit-thermometer/)
- If you have the micro:bit V1, which doesn’t have a microphone, you can remove the code for button B and just take temperature and light level measurements.
- Add ‘show string’ blocks to make it clearer when temperature, sound and light readings are being displayed.
- You can modify the code to show temperature readings in Fahrenheit – see the BBC Fahrenheit thermometer project for tips on how to do this (https://microbit.org/projects/make-it-code-it/fahrenheit-thermometer/)
- If you have the micro:bit V1, which doesn’t have a microphone, you can remove the code for button B and just take temperature and light level measurements.
- Add ‘show string’ blocks to make it clearer when temperature, sound and light readings are being displayed.
- You can modify the code to show temperature readings in Fahrenheit – see the BBC Fahrenheit thermometer project for tips on how to do this (https://microbit.org/projects/make-it-code-it/fahrenheit-thermometer/)
- If you have the micro:bit V1, which doesn’t have a microphone, you can remove the code for button B and just take temperature and light level measurements.
Reflection / Exit Ticket Questions
- What data did you collect?
- What patterns did you find?
- How did the micro:bit help you investigate?
- What would you measure next?
- What data did you collect?
- What patterns did you find?
- How did the micro:bit help you investigate?
- What would you measure next?
- What data did you collect?
- What patterns did you find?
- How did the micro:bit help you investigate?
- What would you measure next?
Extension Opportunities
Students can:
- Create graphs of their data
- Compare indoor vs outdoor environments
- Convert temperature to Fahrenheit
- Add labels to display (e.g., “TEMP”)
- Design a full weather station project
Students can:
- Create graphs of their data
- Compare indoor vs outdoor environments
- Convert temperature to Fahrenheit
- Add labels to display (e.g., “TEMP”)
- Design a full weather station project
Students can:
- Create graphs of their data
- Compare indoor vs outdoor environments
- Convert temperature to Fahrenheit
- Add labels to display (e.g., “TEMP”)
- Design a full weather station project