Graphing and Clearing an Emoji Dataset
In this activity, students are introduced to the critical data science concept of data cleaning by working with an intentionally messy emoji dataset. Students review a list of emoji responses that may include duplicates, inconsistencies, unclear entries, or errors, and must decide how to organize and standardize the data before it can be analyzed.
Materials
-
Lesson Worksheets
https://drive.google.com/file/d/1KORcYAMEyeA3LjdnRkduBLlhr9OzFjEb/view?usp=sharing
Activity Instructions
- Initial Sorting (10–15 minutes)
- Divide students into small groups (2–4 students).
- Provide each group with the same set of emoji tokens.
- Instruct students to sort the emojis into three categories (template provided):
- Happy
- Sad
- Angry
- Once sorted, students may create a bar graph representing their data (template provided).
- Data Discussion – Identify the Problem (5 minutes)
- Did all emojis fit into the categories? (happy, sad, angry)
- Were any difficult to place?
- Did groups make different choices?
- What data was confusing?
- What problems do you notice with the data?
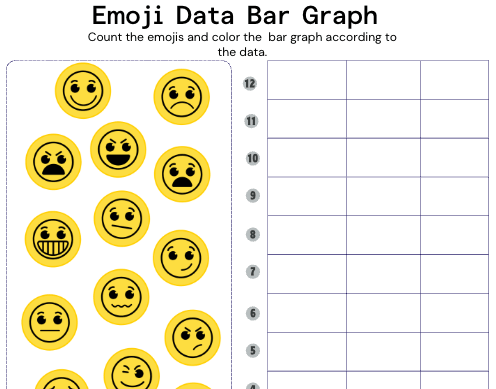
- Emoji Data Bar Graph
- Using the data they sorted, have students create a bar graph on page 2, “Emoji Data Bar Graph”
- Introduce Data Cleaning
- Before we can use data, we often have to clean it.
- Data cleaning means fixing errors, organizing information, and making it consistent.
- Introduce the rules:
- Students may:
- Keep the emoji data the same
- Delete the emoji data (because it’s not useful)
- Change/modify the emoji to clarify the data it represents
- Add an the emoji data category (may not have more than five total categories)
- Students may NOT:
- Move data between the original categories (ex: you may not move a previously categorized
- happy to sad category)
- Create more than two new categories
- Alter the obvious emotion of the emoji
- Students Identify Problems and Clean the emoji data
- Analyze the datasets, looking for:
- Duplicates
- Confusing entries
- Inconsistent categories
- Missing or unclear data
- Clean the Data
- Using page 3, “Cleaning the Emoji Data,” students will decide how to fix the data using the rules we discussed earlier (review rules if needed). Complete each row to determine how to clean and categorize the emoji pictured.
- Create a Data Table
- Students should now organize their cleaned data into structured format using the data table on page 4.
- Final Graph of Cleaned Data
- Using the data they sorted, have students create a bar graph on page 2, “Emoji Data CLEANED Bar Graph”
- Compare Graphs and Reflect
- Discuss:
- What differences do you notice between the two graphs?
- Why did your graph change?
- Initial Sorting (10–15 minutes)
- Divide students into small groups (2–4 students).
- Provide each group with the same set of emoji tokens.
- Instruct students to sort the emojis into three categories (template provided):
- Happy
- Sad
- Angry
- Once sorted, students may create a bar graph representing their data (template provided).
- Data Discussion – Identify the Problem (5 minutes)
- Did all emojis fit into the categories? (happy, sad, angry)
- Were any difficult to place?
- Did groups make different choices?
- What data was confusing?
- What problems do you notice with the data?
- Emoji Data Bar Graph
- Using the data they sorted, have students create a bar graph on page 2, “Emoji Data Bar Graph”
- Introduce Data Cleaning
- Before we can use data, we often have to clean it.
- Data cleaning means fixing errors, organizing information, and making it consistent.
- Introduce the rules:
- Students may:
- Keep the emoji data the same
- Delete the emoji data (because it’s not useful)
- Change/modify the emoji to clarify the data it represents
- Add an the emoji data category (may not have more than five total categories)
- Students may NOT:
- Move data between the original categories (ex: you may not move a previously categorized
- happy to sad category)
- Create more than two new categories
- Alter the obvious emotion of the emoji
- Students may:
- Students Identify Problems and Clean the emoji data
- Analyze the datasets, looking for:
- Duplicates
- Confusing entries
- Inconsistent categories
- Missing or unclear data
- Analyze the datasets, looking for:
- Clean the Data
- Using page 3, “Cleaning the Emoji Data,” students will decide how to fix the data using the rules we discussed earlier (review rules if needed). Complete each row to determine how to clean and categorize the emoji pictured.
- Create a Data Table
- Students should now organize their cleaned data into structured format using the data table on page 4.
- Final Graph of Cleaned Data
- Using the data they sorted, have students create a bar graph on page 2, “Emoji Data CLEANED Bar Graph”
- Compare Graphs and Reflect
- Discuss:
- What differences do you notice between the two graphs?
- Why did your graph change?
- Discuss:
- Initial Sorting (10–15 minutes)
- Divide students into small groups (2–4 students).
- Provide each group with the same set of emoji tokens.
- Instruct students to sort the emojis into three categories (template provided):
- Happy
- Sad
- Angry
- Once sorted, students may create a bar graph representing their data (template provided).
- Data Discussion – Identify the Problem (5 minutes)
- Did all emojis fit into the categories? (happy, sad, angry)
- Were any difficult to place?
- Did groups make different choices?
- What data was confusing?
- What problems do you notice with the data?
- Emoji Data Bar Graph
- Using the data they sorted, have students create a bar graph on page 2, “Emoji Data Bar Graph”
- Introduce Data Cleaning
- Before we can use data, we often have to clean it.
- Data cleaning means fixing errors, organizing information, and making it consistent.
- Introduce the rules:
- Students may:
- Keep the emoji data the same
- Delete the emoji data (because it’s not useful)
- Change/modify the emoji to clarify the data it represents
- Add an the emoji data category (may not have more than five total categories)
- Students may NOT:
- Move data between the original categories (ex: you may not move a previously categorized
- happy to sad category)
- Create more than two new categories
- Alter the obvious emotion of the emoji
- Students may:
- Students Identify Problems and Clean the emoji data
- Analyze the datasets, looking for:
- Duplicates
- Confusing entries
- Inconsistent categories
- Missing or unclear data
- Analyze the datasets, looking for:
- Clean the Data
- Using page 3, “Cleaning the Emoji Data,” students will decide how to fix the data using the rules we discussed earlier (review rules if needed). Complete each row to determine how to clean and categorize the emoji pictured.
- Create a Data Table
- Students should now organize their cleaned data into structured format using the data table on page 4.
- Final Graph of Cleaned Data
- Using the data they sorted, have students create a bar graph on page 2, “Emoji Data CLEANED Bar Graph”
- Compare Graphs and Reflect
- Discuss:
- What differences do you notice between the two graphs?
- Why did your graph change?
- Discuss:
Tips for Running Activity
- Do NOT over-explain categories at first—let students struggle a bit with where emojis belong.
- Use a guiding question like:
- “What do you do when data doesn’t fit your system?”
- Encourage quick first attempts before refining (this makes the cleaning phase more meaningful).
- Ask probing questions:
- “Why did you put that emoji there?”
- “Would everyone agree with that choice?”
- Watch for groups forcing emojis into categories—this sets up a strong need for cleaning.
- During Data Cleaning
- Post the rules clearly (no moving between original categories, max 2 new categories).
- Push reasoning:
- “Why delete instead of create a new category?”
- “What makes your categories fair?”
- If groups finish early, challenge them:
- “Would another group agree with your decisions?”
- Do NOT over-explain categories at first—let students struggle a bit with where emojis belong.
- Use a guiding question like:
- “What do you do when data doesn’t fit your system?”
- Encourage quick first attempts before refining (this makes the cleaning phase more meaningful).
- Ask probing questions:
- “Why did you put that emoji there?”
- “Would everyone agree with that choice?”
- Watch for groups forcing emojis into categories—this sets up a strong need for cleaning.
- During Data Cleaning
- Post the rules clearly (no moving between original categories, max 2 new categories).
- Push reasoning:
- “Why delete instead of create a new category?”
- “What makes your categories fair?”
- If groups finish early, challenge them:
- “Would another group agree with your decisions?”
- Do NOT over-explain categories at first—let students struggle a bit with where emojis belong.
- Use a guiding question like:
- “What do you do when data doesn’t fit your system?”
- Encourage quick first attempts before refining (this makes the cleaning phase more meaningful).
- Ask probing questions:
- “Why did you put that emoji there?”
- “Would everyone agree with that choice?”
- Watch for groups forcing emojis into categories—this sets up a strong need for cleaning.
- During Data Cleaning
- Post the rules clearly (no moving between original categories, max 2 new categories).
- Push reasoning:
- “Why delete instead of create a new category?”
- “What makes your categories fair?”
- If groups finish early, challenge them:
- “Would another group agree with your decisions?”
Assessment Opportunities
Reflection:
- Why is data cleaning important?
- What choices did you make?
- How could messy data lead to incorrect conclusions?
Reflection:
- Why is data cleaning important?
- What choices did you make?
- How could messy data lead to incorrect conclusions?
Reflection:
- Why is data cleaning important?
- What choices did you make?
- How could messy data lead to incorrect conclusions?
Extension Opportunities
Students can:
- Combine class data into one dataset
- Write rules for cleaning data
- Move into a data analysis lesson
Students can:
- Combine class data into one dataset
- Write rules for cleaning data
- Move into a data analysis lesson
Students can:
- Combine class data into one dataset
- Write rules for cleaning data
- Move into a data analysis lesson