Qualitative / Quantitative Emoji Data Science
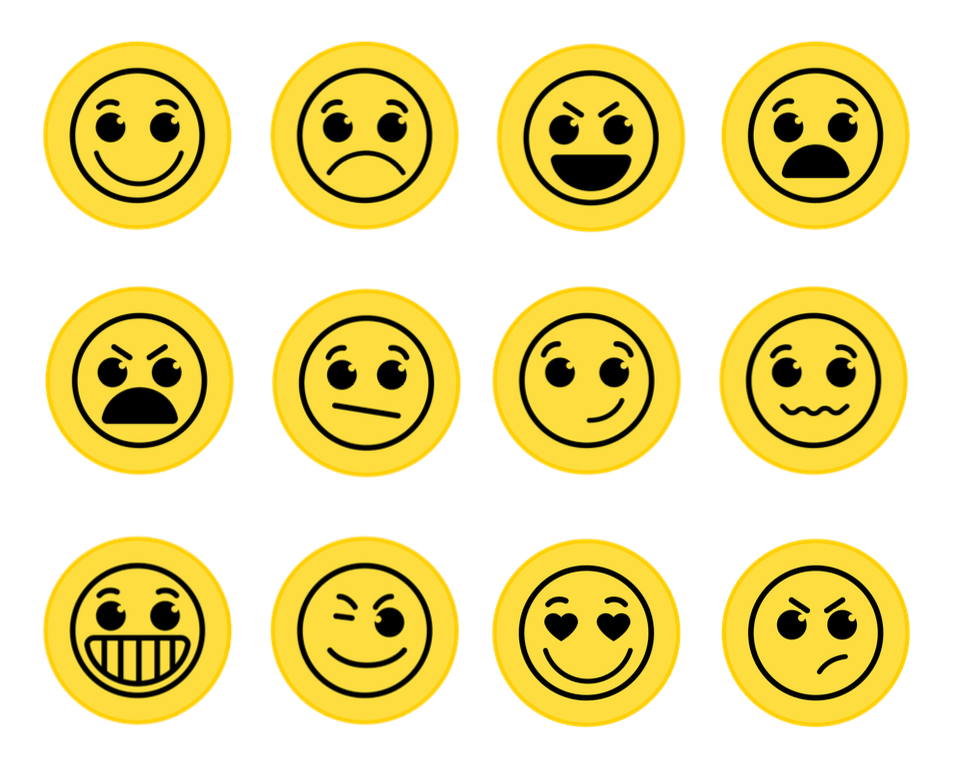
In this activity, students are introduced to the foundational concepts of qualitative and quantitative data through an engaging, visual emoji-sorting task. Students begin by examining a collection of emojis and categorizing them into emotional groups such as happy, sad, and angry, using their own interpretation of each emoji’s meaning. This step emphasizes that qualitative data is subjective and descriptive, based on observation and personal interpretation.
Once students have sorted the emojis, they transition into working with quantitative data by counting how many emojis fall into each category and recording totals in a data table. This process demonstrates how qualitative data can be transformed into quantitative data through counting and organization.
Materials
-
Qualitative / Quantitative Emoji Data
https://drive.google.com/file/d/1P_9LEw5n29KdiqLRPfm0zWzHoCpR0FT7/view?usp=sharing
Activity Instructions
- Introduce the Activity
- Show a few emojis and discuss the emotions that the emoji displays. Today, we’re going to explore how data can be based on opinions—and how we can turn that into numbers.
- Explore opportunities when students disagreed on the emotions:
- Do we all agree?
- Why might people see it differently?
- Introduce Qualitative Data
- Qualitative data is descriptive—it’s based on what we observe and how we interpret things.
- Emotions like happy, sad, and angry are examples of qualitative data because they describe feelings.
- Discuss other examples of qualitative data (how we perceive taste and touch are good examples)
- Sort the Emojis
- Students categorize emojis based on their own interpretation. Sort your emojis into three groups:
- Happy
- Sad
- Angry
- Remind students:
- There is not always one right answer
- If unsure, they can leave an emoji out
- Introduce Quantitative Data
- Quantitative data is numerical—it involves counting or measuring.
- We can turn our emoji groups into quantitative data by counting how many are in each category.
- Count & Record Data
- Now count how many emojis are in each group and convert qualitative categories into numerical data.
- Students:
- Count totals
- Record numbers in the data table
- Analyze & Discuss
- Discuss:
- Which category had the most emojis?
- Did anyone have different results? Why?
- What made some emojis hard to sort?
- This shows that qualitative data can be interpreted differently.
- Reflection
- Discuss:
- What is qualitative data?
- What is quantitative data?
- How did you turn one into the other?
- Why might people have different results?
- Introduce the Activity
- Show a few emojis and discuss the emotions that the emoji displays. Today, we’re going to explore how data can be based on opinions—and how we can turn that into numbers.
- Explore opportunities when students disagreed on the emotions:
- Do we all agree?
- Why might people see it differently?
- Introduce Qualitative Data
- Qualitative data is descriptive—it’s based on what we observe and how we interpret things.
- Emotions like happy, sad, and angry are examples of qualitative data because they describe feelings.
- Discuss other examples of qualitative data (how we perceive taste and touch are good examples)
- Sort the Emojis
- Students categorize emojis based on their own interpretation. Sort your emojis into three groups:
- Happy
- Sad
- Angry
- Remind students:
- There is not always one right answer
- If unsure, they can leave an emoji out
- Students categorize emojis based on their own interpretation. Sort your emojis into three groups:
- Introduce Quantitative Data
- Quantitative data is numerical—it involves counting or measuring.
- We can turn our emoji groups into quantitative data by counting how many are in each category.
- Count & Record Data
- Now count how many emojis are in each group and convert qualitative categories into numerical data.
- Students:
- Count totals
- Record numbers in the data table
- Analyze & Discuss
- Discuss:
- Which category had the most emojis?
- Did anyone have different results? Why?
- What made some emojis hard to sort?
- This shows that qualitative data can be interpreted differently.
- Discuss:
- Reflection
- Discuss:
- What is qualitative data?
- What is quantitative data?
- How did you turn one into the other?
- Why might people have different results?
- Discuss:
- Introduce the Activity
- Show a few emojis and discuss the emotions that the emoji displays. Today, we’re going to explore how data can be based on opinions—and how we can turn that into numbers.
- Explore opportunities when students disagreed on the emotions:
- Do we all agree?
- Why might people see it differently?
- Introduce Qualitative Data
- Qualitative data is descriptive—it’s based on what we observe and how we interpret things.
- Emotions like happy, sad, and angry are examples of qualitative data because they describe feelings.
- Discuss other examples of qualitative data (how we perceive taste and touch are good examples)
- Sort the Emojis
- Students categorize emojis based on their own interpretation. Sort your emojis into three groups:
- Happy
- Sad
- Angry
- Remind students:
- There is not always one right answer
- If unsure, they can leave an emoji out
- Students categorize emojis based on their own interpretation. Sort your emojis into three groups:
- Introduce Quantitative Data
- Quantitative data is numerical—it involves counting or measuring.
- We can turn our emoji groups into quantitative data by counting how many are in each category.
- Count & Record Data
- Now count how many emojis are in each group and convert qualitative categories into numerical data.
- Students:
- Count totals
- Record numbers in the data table
- Analyze & Discuss
- Discuss:
- Which category had the most emojis?
- Did anyone have different results? Why?
- What made some emojis hard to sort?
- This shows that qualitative data can be interpreted differently.
- Discuss:
- Reflection
- Discuss:
- What is qualitative data?
- What is quantitative data?
- How did you turn one into the other?
- Why might people have different results?
- Discuss:
Tips for Running Activity
- Emphasizes:
- Data is not always objective
- Human interpretation affects results
- Expect:
- Disagreement (this is valuable!)
- Discussion about meaning and context
- Key takeaway for students: Data can start as ideas or observations and become numbers through organization
- Emphasizes:
- Data is not always objective
- Human interpretation affects results
- Expect:
- Disagreement (this is valuable!)
- Discussion about meaning and context
- Key takeaway for students: Data can start as ideas or observations and become numbers through organization
- Emphasizes:
- Data is not always objective
- Human interpretation affects results
- Expect:
- Disagreement (this is valuable!)
- Discussion about meaning and context
- Key takeaway for students: Data can start as ideas or observations and become numbers through organization
Extension Opportunities
Students can:
- Create a bar graph of their data
- Compare results across groups
- Add more categories (excited, confused, etc.)
- Write explanations for difficult-to-sort emojis
- Conduct a class-wide data collection
Students can:
- Create a bar graph of their data
- Compare results across groups
- Add more categories (excited, confused, etc.)
- Write explanations for difficult-to-sort emojis
- Conduct a class-wide data collection
Students can:
- Create a bar graph of their data
- Compare results across groups
- Add more categories (excited, confused, etc.)
- Write explanations for difficult-to-sort emojis
- Conduct a class-wide data collection