micro:bit Sound Logger
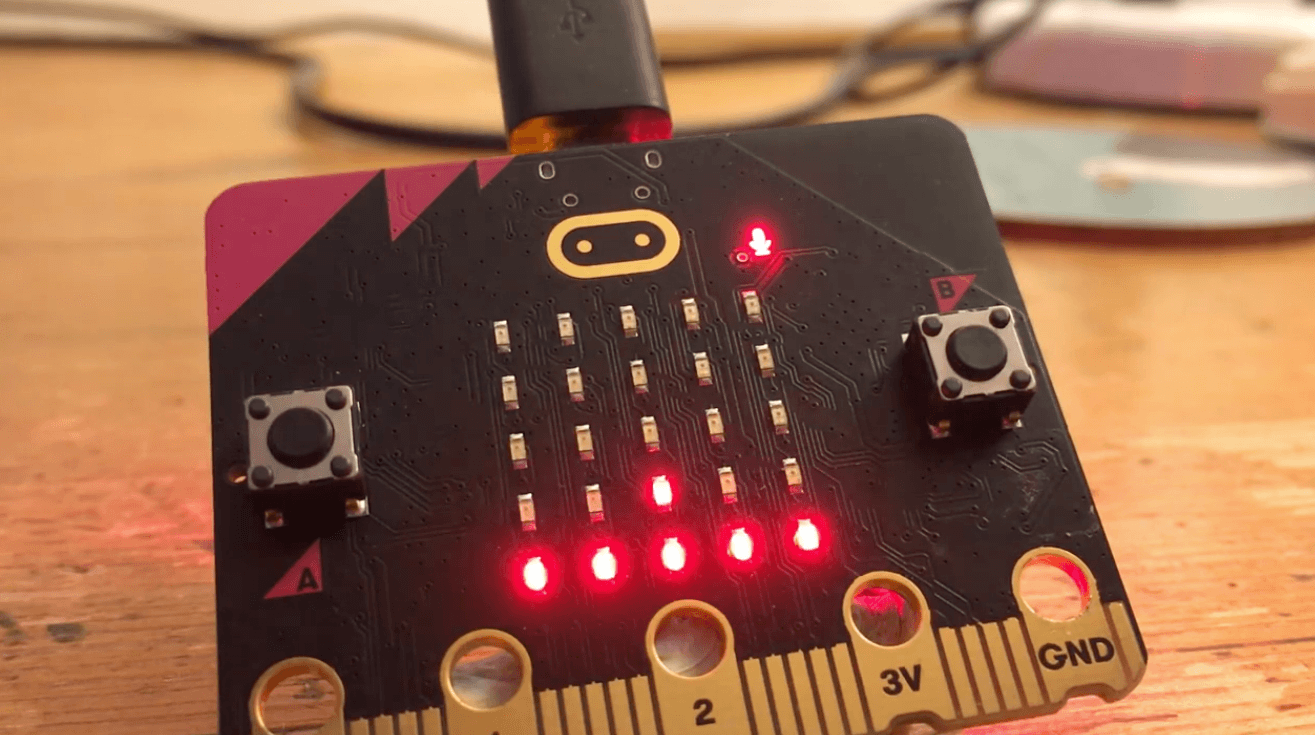
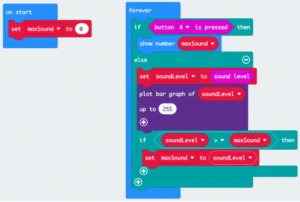
This activity introduces students to data logging by creating a loop that constantly compares the current sound level with a variable ‘maxSound’ storing the loudest sound. If the current sound is louder than the loudest previous sound, it resets maxSound to the new loudest sound value. This program turns the BBC micro:bit to act as a real-time sound monitoring device that uses its built-in microphone to measure sound levels (0–255) and continuously compare the current level to a stored maximum value, allowing it to track how loud an environment becomes over time.
Materials
-
BBC micro:bit Sound logger activity
https://microbit.org/projects/make-it-code-it/sound-logger/ -
Sound logger introduction video
https://youtu.be/RmEJSV6OqVo?si=kuoo3e3ev9sPe1zR -
Sound logger code video
https://youtu.be/O5KfydwWAOo?si=AZ8OnLRpUSny-nNj -
Example MakeCode
https://makecode.microbit.org/#pub:_4fPbdWMhiV2w
Activity Instructions
- Introduce the activity
- Discuss: Have you ever wondered how loud your classroom gets during the day?
- When is it the loudest?
- When is it the quietest?
- Conclude by telling students – Today, you’re going to build a device that remembers the loudest sound it hears.
- Introduce the Concept
- Instead of just measuring sound once, we’re going to track it over time.
- Explain:
- “This is called data logging—recording data as it changes.”
- Data logging means collecting data over time for analysis
- Build the Code
- Let’s create a program that keeps track of sound.
- Walk students through creating the following code or use the provided link to share the completed code with students.
- Test the Logger
- Let’s see how loud things get!
- Students:
- Make different sounds (clap, talk, tap desk)
- Walk to different locations
- Press button A to check max value
- Reflect on the data test -What kinds of sounds gave the highest readings?
- Explore & Investigate
- Now use your sound logger like a real tool.
- Try:
- Quiet vs noisy areas
- Group work vs silent reading
- Sudden loud sounds vs background noise
- Analyze & Discuss
- What patterns do you notice over time?
- When was it loudest?
- Why did that happen?
- Did your data match expectations?
- Introduce the activity
- Discuss: Have you ever wondered how loud your classroom gets during the day?
- When is it the loudest?
- When is it the quietest?
- Conclude by telling students – Today, you’re going to build a device that remembers the loudest sound it hears.
- Discuss: Have you ever wondered how loud your classroom gets during the day?
- Introduce the Concept
- Instead of just measuring sound once, we’re going to track it over time.
- Explain:
- “This is called data logging—recording data as it changes.”
- Data logging means collecting data over time for analysis
- Build the Code
- Let’s create a program that keeps track of sound.
- Walk students through creating the following code or use the provided link to share the completed code with students.
- Test the Logger
- Let’s see how loud things get!
- Students:
- Make different sounds (clap, talk, tap desk)
- Walk to different locations
- Press button A to check max value
- Reflect on the data test -What kinds of sounds gave the highest readings?
- Explore & Investigate
- Now use your sound logger like a real tool.
- Try:
- Quiet vs noisy areas
- Group work vs silent reading
- Sudden loud sounds vs background noise
- Analyze & Discuss
- What patterns do you notice over time?
- When was it loudest?
- Why did that happen?
- Did your data match expectations?
- Introduce the activity
- Discuss: Have you ever wondered how loud your classroom gets during the day?
- When is it the loudest?
- When is it the quietest?
- Conclude by telling students – Today, you’re going to build a device that remembers the loudest sound it hears.
- Discuss: Have you ever wondered how loud your classroom gets during the day?
- Introduce the Concept
- Instead of just measuring sound once, we’re going to track it over time.
- Explain:
- “This is called data logging—recording data as it changes.”
- Data logging means collecting data over time for analysis
- Build the Code
- Let’s create a program that keeps track of sound.
- Walk students through creating the following code or use the provided link to share the completed code with students.
- Test the Logger
- Let’s see how loud things get!
- Students:
- Make different sounds (clap, talk, tap desk)
- Walk to different locations
- Press button A to check max value
- Reflect on the data test -What kinds of sounds gave the highest readings?
- Explore & Investigate
- Now use your sound logger like a real tool.
- Try:
- Quiet vs noisy areas
- Group work vs silent reading
- Sudden loud sounds vs background noise
- Analyze & Discuss
- What patterns do you notice over time?
- When was it loudest?
- Why did that happen?
- Did your data match expectations?
Tips for Running Activity
- This is a strong introduction to data logging + variables as memory
- Students often struggle with:
- Understanding variables updating over time
- Difference between current value vs stored value
- Emphasize:
- The micro:bit is constantly “listening”
- The variable is like a memory of the loudest moment
- This is a strong introduction to data logging + variables as memory
- Students often struggle with:
- Understanding variables updating over time
- Difference between current value vs stored value
- Emphasize:
- The micro:bit is constantly “listening”
- The variable is like a memory of the loudest moment
- This is a strong introduction to data logging + variables as memory
- Students often struggle with:
- Understanding variables updating over time
- Difference between current value vs stored value
- Emphasize:
- The micro:bit is constantly “listening”
- The variable is like a memory of the loudest moment
Extension Opportunities
Students can:
- Track minimum (quietest) sound levels
- Add a visual bar graph display
- Log data over a longer time period
- Compare results between groups
- Use radio to send data to another micro:bit
- The project can be extended to track minimum values or send data remotely
Students can:
- Track minimum (quietest) sound levels
- Add a visual bar graph display
- Log data over a longer time period
- Compare results between groups
- Use radio to send data to another micro:bit
- The project can be extended to track minimum values or send data remotely
Students can:
- Track minimum (quietest) sound levels
- Add a visual bar graph display
- Log data over a longer time period
- Compare results between groups
- Use radio to send data to another micro:bit
- The project can be extended to track minimum values or send data remotely